
Long Tail Analysis Ulabox — Opportunity Products
Long Tail Analysis Ulabox — Opportunity Products


I’m a 3 year worker in Ulabox, an Online Supermarket that is trying to revolutionize the retail market in Spain.
We call ourselves #ElAntisúper. 🚚 🍞 🐟 🍖 🍉
Nowadays I’m working under the Commercial Department, more specifically Responsible for Sales of Non-Food.
However, my first baby steps were in Business Intelligence, where I found a greater enthusiasm for data driven models and strategies.
In college, I found it interesting but the lack of empirical experiences and practical results, made me not appreciate it like I should have had.
In Ulabox, where we are constantly learning while E-Commerce is thriving… I was able to understand the real consequences of a detailed dashboard.
Thematic Data Theme every Friday
In Ulabox we have a kind of thematic theme every Friday, inspired by one of the IT employees, where he gathers some data and construct a curious argument around it… It’s pretty cool!! 😜
The objective of the exercise is not to implement a new plan or high detailed project, but to play around with valuable data.
However, it’s common to try to translate some conclusions daily activities (mainly my department to blame).
I really like when there are new concepts discovered based on data… it stuck to me the old example in retail of the shopping behavior of diapers and beers… “Beer, Diapers, and Correlation: A Tale of Ambiguity”.
This article has it quite well explained (view), but in a resume mode is that diapers and beers are positive correlated and there is an incremental value for both when put it together. 👶🍻
As you can read in the article this “stories” are not necessarily true, there is a lot of variables that are difficult to control and maintain constant (stock level, visibility, other competitors campaigns, external campaigns, etc) that could allow you to have a strong conclusion about some experience… but that’s not the point.
I enjoy when you find out that something that at a first glance would not make much sense, but in the end it works.
Another fun old “story” would be “The Lack of Pirates Is Causing Global Warming” (view).
Customers always buy the Same Products?
💭🍳🍍
So, going back to Ulabox world, one of many “Curious Data Mails” was about “If Customers would always buy the Same Products”.
There would be 4 types of Product’s Classifications, based on the product’s buying frequency:
A -> Top Products for the Client (clients buy them in more than half of theirs purchases)
B -> Usual Products (clients buy them once each 4 purchases)
C-> Unusual Products (clients buy them occasionally)
D -> No Frequency Products (clients just by them once… in some cases its understandable like home appliances)
Applying these criteria you end up having some very cool conclusions:
Product Ranking by Frequency of Purchase for Customer (based on the different number of clients in each type of Product’s Classifications for each Product you can define distinct characteristics like: Polarization; Loyalty)
Type of Product’s Classifications in Orders (for example: A: 24%, that means that in a normal purchase 24% of it is represented by Top Products for the Client)
#Orders Needed to go From “Unusual Products” to “Usual Products” (or other ranking moves)

There was some very interesting bullet points and comparisons for example:
👉 A type of eggs that had a very high loyalty and also very high polarization. Or a brand of water that had very high loyalty and low polarization.
👉 And the number of purchases to go from “Unusual Products” to “Usual Products” in some category of products was just 5 in others was 30.
I was having the time of my life while playing around with the data, and so, I decided to mix a little bit more data on it.

I calculated the “Ranking Long Tail in Products”, that distinguish each product by its weigh in sales. Since we already had the “Ranking Long Tail in Orders”, that distinguish each product by its presence in purchases.
For the “Ranking Long Tail in Products” I had a new classification:
A -> products that represent [80%; 100%] of Total Sales
B -> products that represent [5%; 80%] of Total Sales
C -> products that represent [0%; 5%] of Total Sales
And I crossed the 2 classifications:
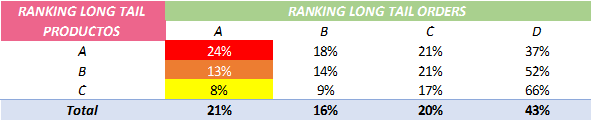
RED are the products (distinguished by orders) that are seen has HOT SAUCE -> clients are very loyal and a lot of clients buy them.
YELLOW are the products (distinguished by orders) that are the OPPORTUNITY PRODUCTS -> few clients buy them, but the ones that do it becomes very loyal to the product.
Happily ever after?
After automatizing this kind of tools, that gather value data on consumer behavior, we are able to offer the best personalized and relevant purchase experience. Stop showing off the most sold, and suggest the most interesting ones for each customer. 😉
Side note: don’t forget to always check the list of suggestions, because you may end up suggesting products that clients actually were already thinking to purchase. So, you would just lose a great opportunity to suggest an up-sell product.
*this article is strictly from a personal point of view